May 2018 · and what it left behind
The storm was over in six hours. The moisture in the ground under a solid masonry wall is a much slower story, and in Hobart it is slower again.
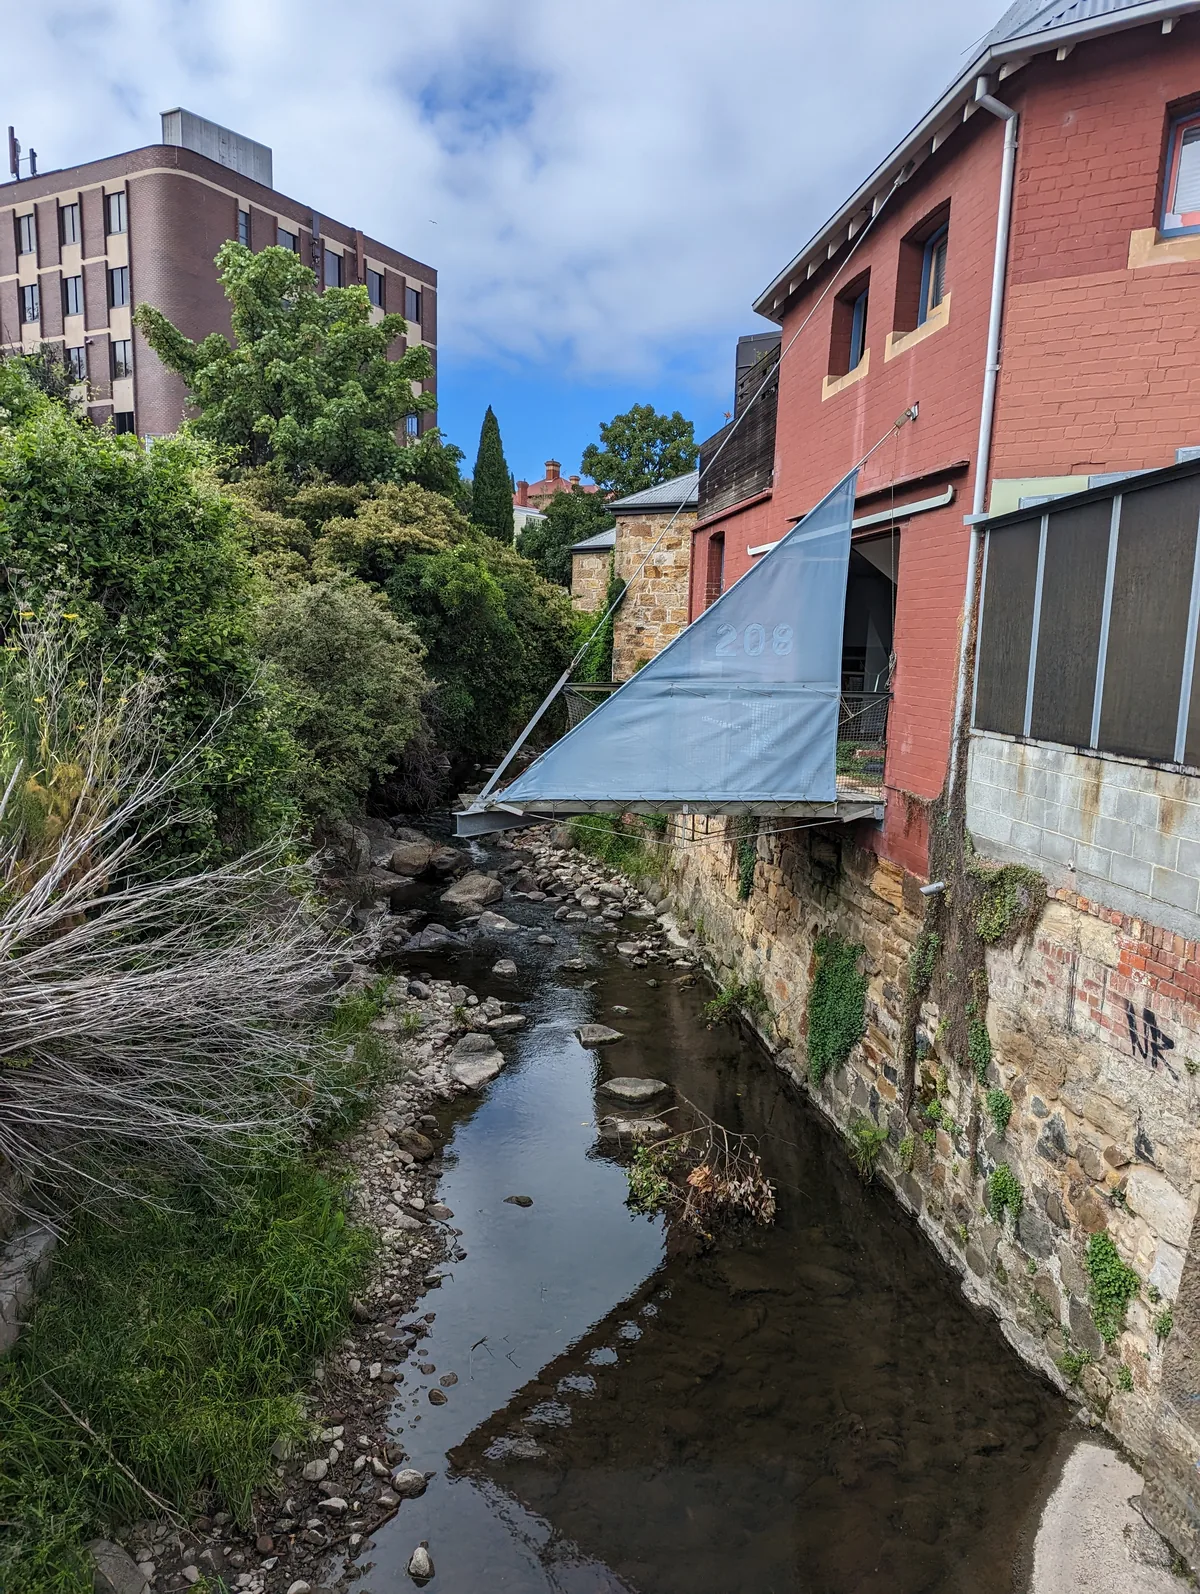
For damp in Hobart, the 2018 flood is the single event most worth understanding, so Rising Damp Hobart sets out here what actually happened. On 10–11 May 2018 a line of thunderstorms sat over Hobart and the Wellington Range. The city recorded 128 mm of rain, a third of it between 10.00pm and 11.00pm on the Thursday. 236.2 mm fell on kunanyi and 226.4 mm at Leslie Vale. The Hobart Rivulet broke its banks and flash flooding reached the Hobart CBD, Salamanca, South Hobart, Sandy Bay, New Town, Blackmans Bay and Kingston. The event is recorded as having an annual exceedance probability of less than one per cent. In plain terms: rainfall that is not supposed to happen in a lifetime. Insurers received almost 8,800 claims, with private property damage over $99.7 million and a total bill of more than $137 million.
The visible damage was repaired a long time ago. What is harder to see is what happened to the ground. Water arriving that fast does not soak in evenly. It runs downhill. It ponds against whatever stands in its way. And it soaks the soil around and under the footings. A wall does not care whether the water in the ground beneath it came from a storm or from a leaking downpipe. It draws it up either way.
What makes it worse here is the drying, not the flooding. A house raised on stumps over an open subfloor, somewhere with a hot dry summer, sheds that water back out within a season. A Hobart cottage is usually solid masonry standing straight on rubble or slate footings. There is no cavity, and often no subfloor at all. And the drying season here is short. That is why a flooded house in Hobart can still be wet at the base years afterwards.
Flood and stormwater carry dissolved salts. Those salts go into the masonry with the water, and they stay when the water leaves. As the wall dries, those salts travel to the surface and crystallise. That is the white bloom you see on the stone. It is also why render and paint keep lifting, no matter how many times they are made good. A wall can be structurally dry and still be shedding its finish because of what the 2018 water put into it. Treating that is a different job from installing a damp course. An assessment should tell you which one you have, or whether you have both.
| What it is | What gives it away | |
|---|---|---|
| Flood legacy | Salts and moisture left in the fabric by water that has since gone | Started after a known event; finishes keep failing at and above the old water line |
| Lateral damp | Wet ground pressing sideways through a wall, usually on the uphill side of a cut-in block | Worst on the high side of the house; can be well above floor level |
| Rising damp | Groundwater drawn up through the base of the wall by capillary action | Rises from the floor and stops at a level tide mark |
Hobart can produce all three, sometimes in the same house, because the city is built on a slope running down off a mountain to an estuary. Anyone who quotes a damp course without first working out which of the three you have is guessing. A damp course will not fix the other two. That is the single most useful thing on this page.
You do not need us to answer this, and you should not take anyone's word for it — the mapping is public. LISTmap carries statewide flood mapping: search your address and zoom in to see modelled flood depth for the 1% AEP, 2% AEP and projected 2100 scenarios. The Tasmania SES strategic flood maps explain what those scenarios mean. The SES also publishes plain-language guides by area. The South Hobart flood guide is one of them. Where a council has done its own study the detail is finer, so check the City of Hobart flood risk and maps as well.
A property that shows in the mapping is not a property with rising damp, and a house with rising damp need never have seen a flood. The mapping tells you about one possible source of water. The assessment tells you what your wall is actually doing.
Ask your insurer, not us, and ask in writing. What is worth knowing before you call is that policies generally treat a sudden event and gradual deterioration very differently. Damage caused by a flood may be covered. Damp that has built up slowly over years is usually excluded, whatever set it off. That is why the date things started matters. Write down what you remember about 2018 now, before the memory gets vaguer. We are not insurance advisers and nothing here is advice about your policy.
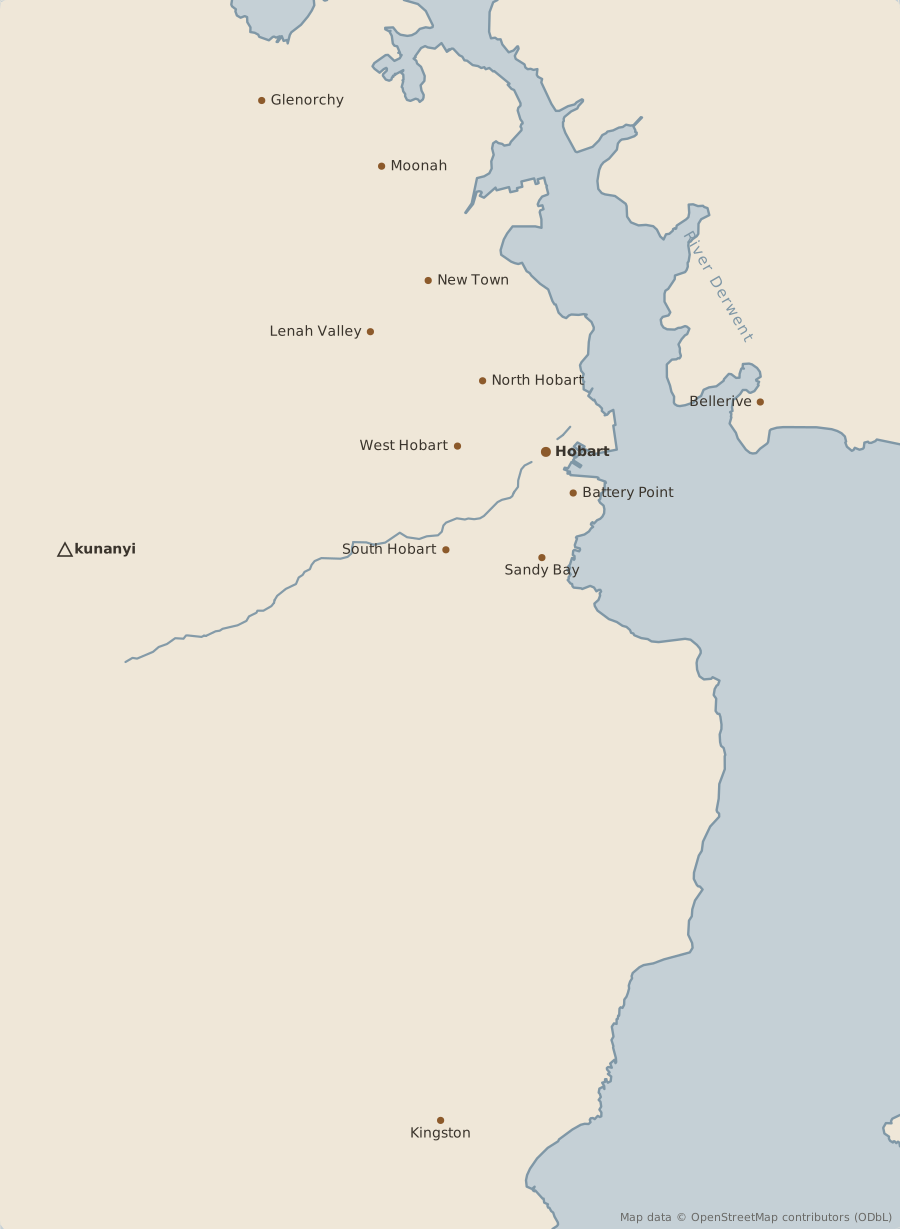
We cover Hobart and the surrounding suburbs, from the Georgian cottages of Battery Point to the post-war brick of Glenorchy and Moonah.
We come out, meter the walls, look at the ground levels and tell you what is causing it. You get that in writing before we quote any repair. The visit is $450 plus GST.